Question: What is the cost to the US economy of racial and ethnic health inequities?
Meaning: The costs of racial and ethnic health inequities are unacceptably high and warrant societal investments in policies and interventions to promote health equity.
Abstract
The study used cross-sectional analysis using nationally representative secondary data to estimate the economic burden of racial and ethnic health inequities in the US. The data included 2016-2019 data from the Medical Expenditure Panel Survey (MEPS), state-level Behavioral Risk Factor Surveillance System (BRFSS), 2016-2018 mortality data from the National Vital Statistics System (NVSS), and 2018 IPUMS American Community Survey (ACS).
87,855 survey respondents to MEPS, 1,792,023 survey respondents to the BRFSS, and 8,416,203 death records from the NVSS were exampled to determine the sum of excess medical care costs, lost labor market productivity, and excess premature death (before age 78) costs by race and ethnicity compared to health equity goals.
Background
Most racial and ethnic health inequities exist because there are differences among these groups in their exposure to economic, social, structural, and environmental risks and their access to healthcare. This study was commissioned by the NIMHD and updates our previous estimates of the US’s economic burden of health inequities. We focused on American Indian or Alaska Native (AIAN), Asian, Black or African American (Black), Hispanic or Latino (Latino), and Native Hawaiin or Other Pacific Islander (NHOPI) because their health is impacted by disparities in the health care delivery system, public health system, employment, education, transportation, public safety, and other systems that are social determinants of health. The study shows that health inequities are also an economic concern for society.
Methods
Detailed Description of the Methodology
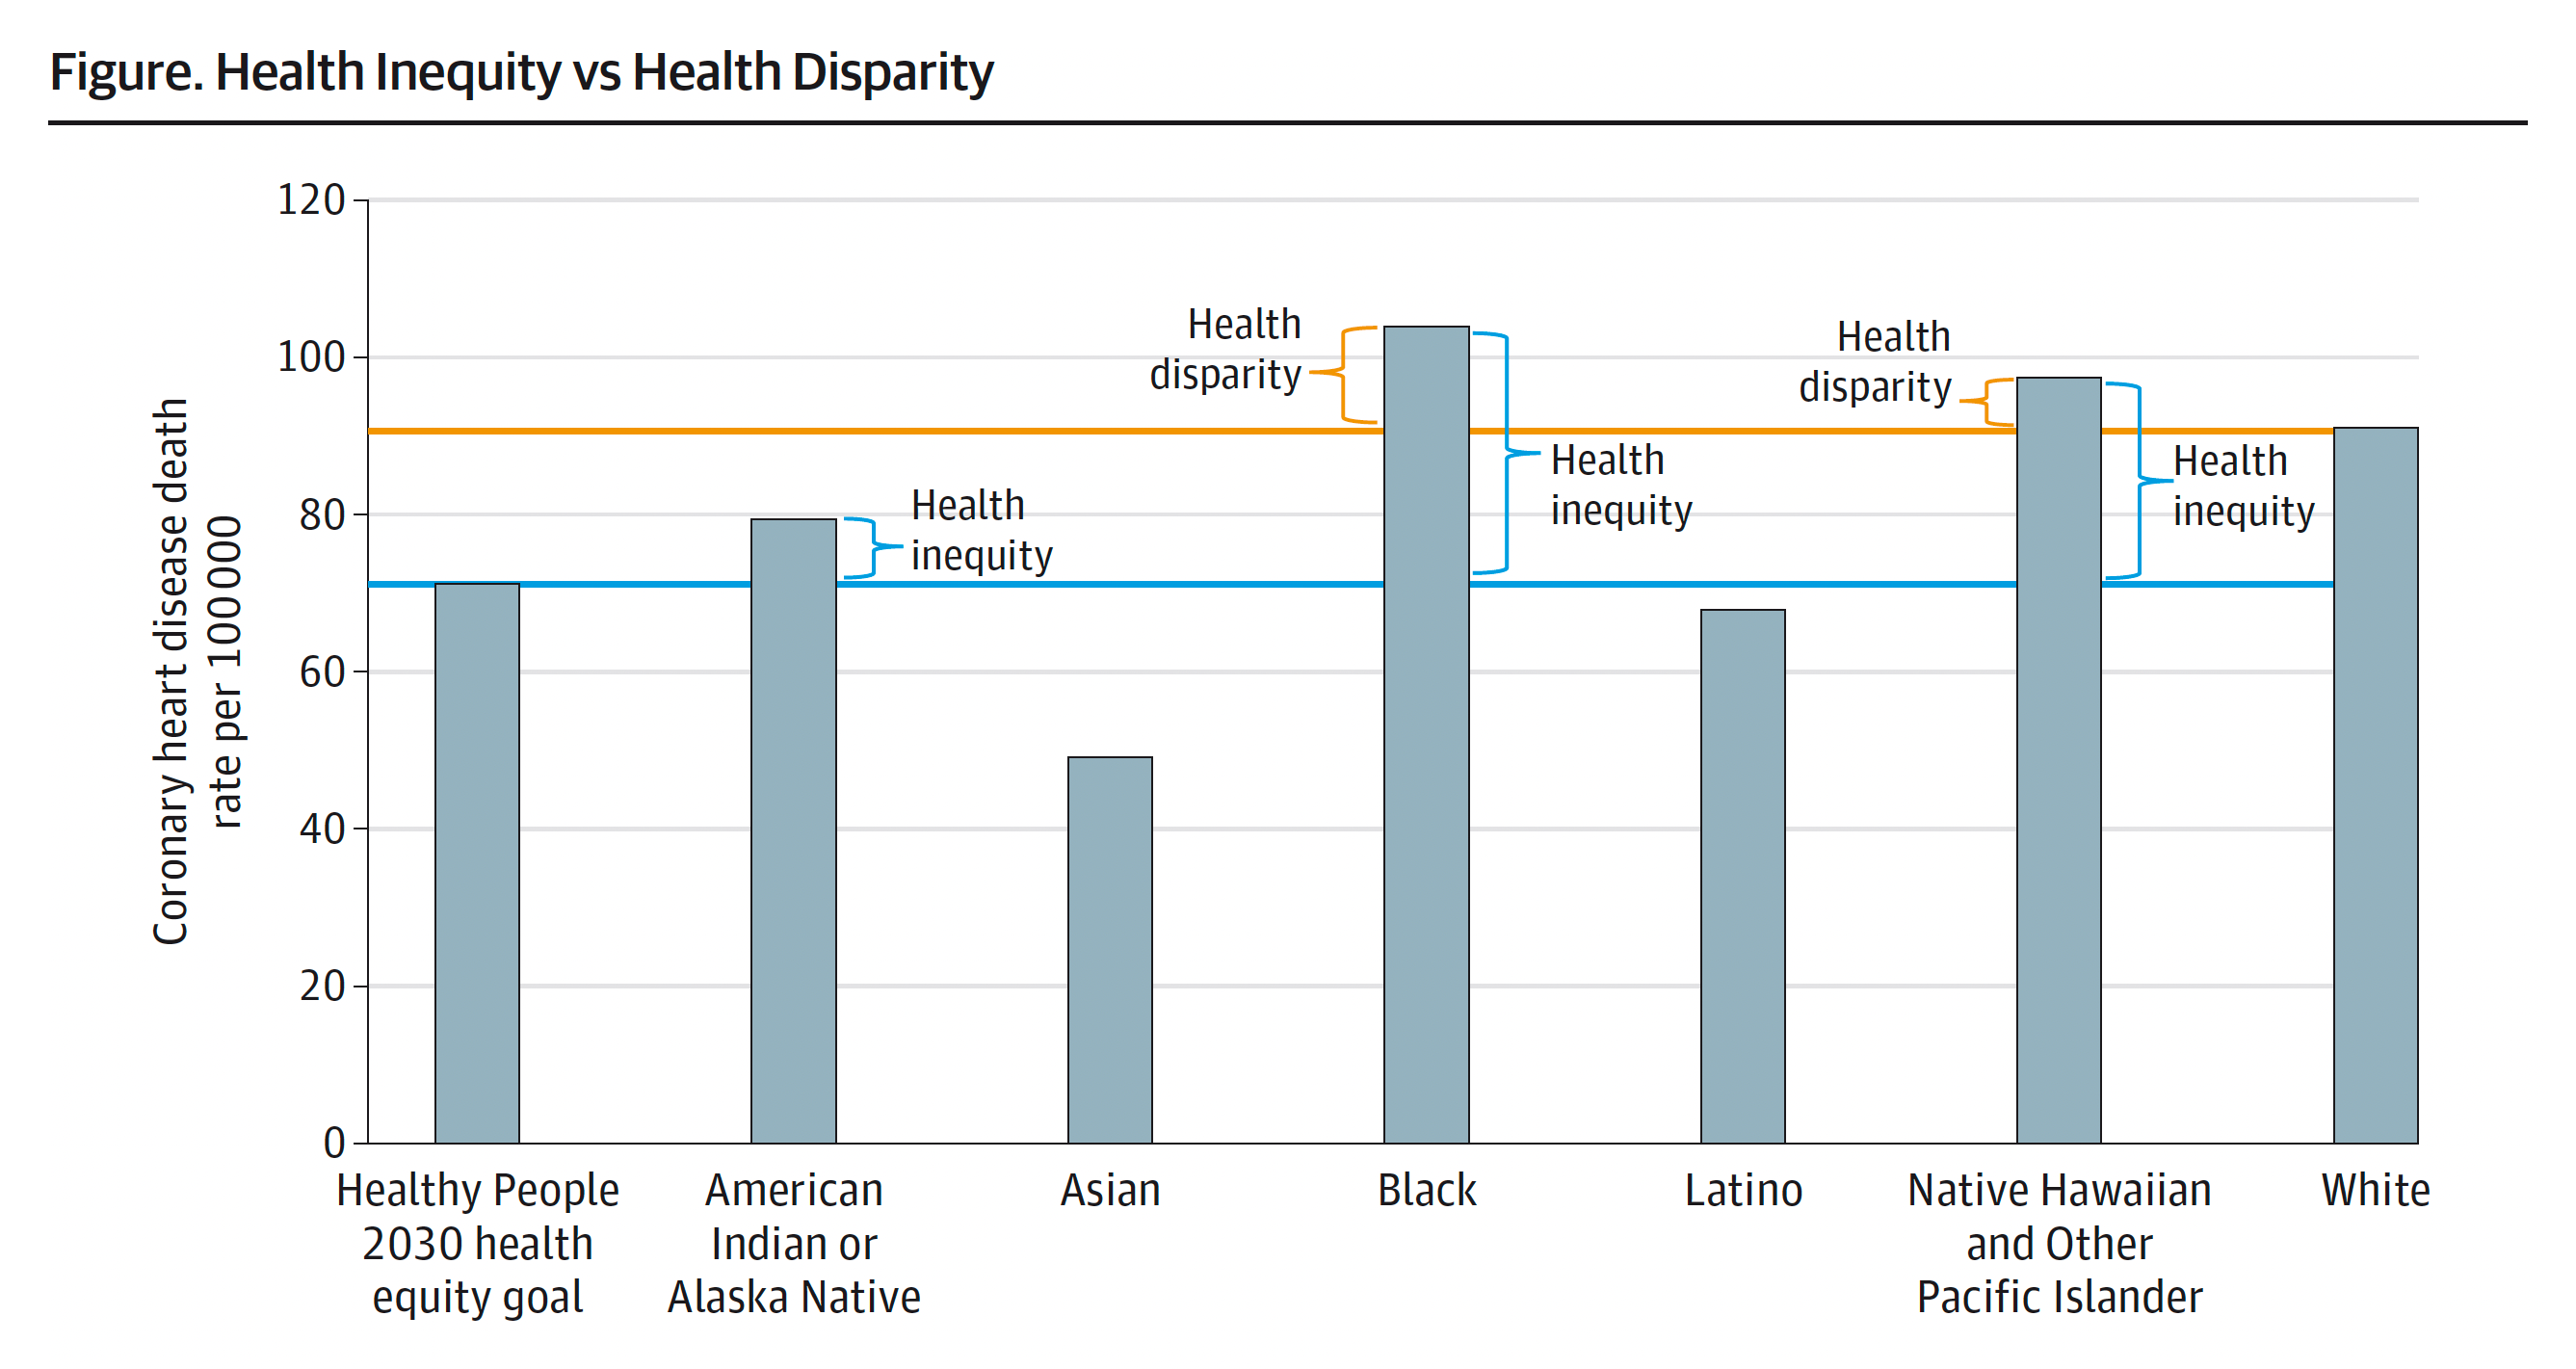
To compute excess medical care expenditures and lost labor market productivity, we used an incremental approach based on regression models for medical care costs, hours worked, wages, and sick days. We simulated the outcomes using the prevalence rates from the MEPS or BRFSS data and health equity goals. We computed the costs of health inequities as the difference between the predicted outcomes using the actual health conditions and the healthy equity targets. To estimate the cost of premature death, we computed crude death rates by race and ethnicity for ten age groups: under 1, 1-9, 10-19, 20-29, 30-29, 40-49, 50-59, 60-69, 70-79, and 80 and over. We then estimated the number of deaths that would have occurred for each racial/ethnic group if every group’s death rate were equal to the health equity target death rate within each category. The difference between the actual number of deaths and the estimated deaths represents “excess deaths.” We computed the number of years of life lost in each racial/ethnic group by assuming that all persons would have lived to age 78 had they not died prematurely since that was the average life expectancy in the US in 2018. We then computed the premature death cost by multiplying the years of life lost by $100,000. (View Figure 1)
Figure 1. Health Inequity vs Health Disparity
2019 Coronary heart disease death rate. Health inequity and disparity are illustrated for each of 6 racial and ethnic population groups. The baseline for health inequity (shown in blue) is the Healthy People 2030 equity goal. The baseline for health disparity (shown in orange) is the mean for the White population.
Definition of Health Equity Perspective
We established a health equity target of reaching the 90th percentile of the predicted prevalence rates for health conditions and the 10th percentile of crude deaths. Using the MEPS adult sample, we estimated prevalence models for each health condition, including fair/poor health, diabetes, joint pain/arthritis, depression, any limitation of activities, hypertension, high cholesterol, stroke, heart attack, coronary heart disease/angina, asthma, emphysema/chronic bronchitis, and cancer. The sample was divided into 14 cohorts based on sex and seven more age groups: 18-24, 25-34, 35-44, 45-54, 55-64, 65-74, and 75 and over. Within each cohort, we identified the risk of each health condition at the 90th percentile. To compute years of life lost due to premature death, we ordered the states from lowest to highest crude death rates for each category, identified the 5th state with the lowest rate, and used the crude death rate for that state as the healthy equity goal for that age category.
Estimating the Direct Cost of Medical Care Due to Excess Morbidity
Modeling Medical Care Expenditures
Using the MEPS data, we built a regression model from the 2016 survey. We used a two-part estimation technique for the medical costs. The first part was a logistic regression model to estimate the impact of health conditions on the probability of having any time of medical care expenditures, and the second part was a generalized linear model to estimate the impact of the conditions on levels of expenditures for individuals with positive expenditures. Our dependent variable was total medical expenditures, and the predictor values were the health conditions.
Predicting Excess Medical Care Expenditures
Using the MEPS and BRFSS data, we simulated medical care costs using the reported health conditions and assigned each group the target prevalence rate for the condition within the age/sex cohort. The respondents in each cohort were randomly assigned the conditions using a uniform distribution, so the prevalence rate for the condition was at the 90th percentile. We randomly chose 1,000 samples to get one predicted probability and one predicted mean for the models. We repeated this exercise 1,000 times to get 1,000 predicted probabilities and 1,000 predicted means by race and ethnicity.
Estimating the Value of Lost Labor Market Productivity
To compute the value of lost productivity, we built three separate two-part labor market models. We estimated the impact of health conditions on three outcomes: disability and illness on sick days, annual hours of work, and wages for working adults ages 25-64.
We predicted disability days off from work, annual hours worked, and hourly wages using the reported health conditions from the MEPS and BRFSS data. We then simulated the labor market outcomes by assigning each group a health condition.
Estimating the Costs of Excess Premature Death
Premature deaths are deaths that may be preventable through lifestyle modifications, better access to health care, and basic resources, such as food and housing. Typical measures of premature death estimate potential life lost when death occurs before one would expect according to population average death rates.
Calculating the Costs of Premature Death based on Willingness to Pay
Willingness to pay is a comprehensive measure of the private valuation individuals place on small reductions in risk of death. Generally, an individual’s willingness to pay has been assessed using surveys. Conceptually, the measure captures everything that would contribute to a person’s well-being, including time preference, non-labor income, the value of leisure, and the value of pain and suffering.
Analytic Approach
The estimate of costs of health inequities has three components: excess medical care expenditures, lost labor market productivity, and premature death costs. To compute excess medical care expenditures and lost labor market productivity, we used an incremental approach based on regression models for medical care costs; hours worked, wages, and sick days simulating costs using the MEPS or BRFSS data. To estimate the cost of premature death, we computed crude death rates by race and ethnicity for ten age groups: under 1, 1-9, 10-19, 20-29, 30-29, 40-49, 50-59, 60-69, 70-79, and 80 and over. We then estimated excess deaths and subsequent years of life lost reality to the health equity goals. We valued a year of life lost at $100,000 to reflect recent estimates, which have valued willingness to pay at $95,000 to up to $264,000.
Results
In 2018, the overall economic burden of failing to achieve the health equity goals was $1.03 trillion. This included $421.1 billion for racial and ethnic minorities and $608.7 billion for the White population. For racial and ethnic minorities, approximately two-thirds of the economic burden was attributable to premature death, while excess medical care costs were 18% and lost labor market productivity were 14%. The study also found that most of the costs were attributable to the Black population; however, costs attributable to Native Hawaiian or Other Pacific Islander and American Indian or Alaska Native populations were disproportionately greater than their share of the population.
The economic costs of racial and ethnic health inequities are unacceptably high. In some states, the economic burden of racial and ethnic health inequity is over twice the growth rate of the nation’s economy. Therefore, federal, state, and local policymakers must invest resources to develop research, policies, and practices to eliminate these inequities in the US. Additionally, state health policymakers and state officers of minority health should use this information to guide their policies and programs to address the inequities in their state. The magnitude of the costs is not the only thing that needs to be considered, but also how the state’s costs compare to the size of their economy.
The COVID-19 pandemic has increased the cost of health inequities, given the pandemic’s disproportionate impact on Black, Latino, and AIAN populations. With the higher excess death rates due to the pandemic, an increased number of hospitalizations, and disruptions to the labor market that employ large numbers of Black and Latino workers, we anticipate the cost of health inequity will have increased in 2020 and 2021 due to its disruption of follow-up visits, screening tests, and even treatments that would have likely resulted in reduced early detection of cancers and costly chronic illnesses. Furthermore, worsening mental health, substance misuse, and violence will exacerbate existing disparities in the area. This disruption in care may have reduced medical care expenditures in the short term, but the delay in treatment may increase care costs in future years.
With our study, there were several limitations. First, we could not always compute estimates for the AIAN and NHOPI populations, even when we pooled the data across three years, because the sample sizes were too small. Second, the MEPS excludes persons residing in institutions and persons in the military, so our medical care and labor market estimates exclude costs associated with these groups. We also excluded children since they face different health inequities than adults and are not typically in the labor force. However, the premature death calculation does include children, persons in institutions, and persons in the military. Third, our labor market outcomes model excluded adults over 64 and under 25. Fourth, our simulation assigned health conditions to individuals as the occurrence of one condition is unrelated to the others, even though it is well-known that some conditions are more likely to co-occur with others, such as diabetes, hypertension, and heart disease. It is unclear how this lack of accounting for the covariance biases our excess medical care costs and lost labor market productivity estimates.
The costs and racial and ethnic health inequities to the US economy are substantial and more than justify the societal investment in developing policies and programs to eliminate health inequities and larger data sets for smaller racial and ethnic subpopulations. Even a modest reduction in health inequalities can save the nation billions of dollars in medical spending and lost labor market productivity annually.
Gracia JN. Margaret Heckler’s commitment to advancing minority health [published online November 16, 2018]. Health Affairs. DOI: 10.1377/hblog20181115.296624
Heckler MM. Report of the Secretary’s Task Force Report on Black and Minority Health. Washington, DC: US Department of Health and Human Services; 1985.
Institute of Medicine (US) Committee on Understanding and Eliminating Racial and Ethnic Disparities in Health Care, Smedley BD, Stith AY, Nelson AR, eds. Unequal Treatment: Confronting Racial and Ethnic Disparities in Health Care. Washington (DC): National Academies Press (US); 2003.
LaVeist TA, Gaskin D, Richard P. Estimating the economic burden of racial health inequalities in the United States. International Journal of Health Services. 2011;41(2):231-238. doi:10.2190/HS.41.2.c
Turner A. The Business Case for Racial Equity: A Strategy for Growth. Altarum Report. 2018.
Duran DG, Pérez-Stable EJ. Science visioning to advance the next generation of health disparities research. AJPH. 109(502) S11-S13. doi:10.2105/AJPH.2018.304944
Braveman P. What are health disparities and health equity? We need to be clear. Public Health Rep. 2014;129 Suppl 2(Suppl 2):5-8. doi:10.1177/00333549141291S203
Braveman PA, Kumanyika S, Fielding J, Laveist T, Borrell LN, Manderscheid R, et al. Health disparities and health equity: the issue is justice. Am J Public Health. 2011;101(Suppl 1):S149–55. doi:10.2105/AJPH.2010.300062.
American Diabetes Association; Economic Costs of Diabetes in the U.S. in 2017. Diabetes Care 1 May 2018; 41 (5): 917–928. https://doi.org/10.2337/dci18-0007.
Gaskin DJ, Richard P. The economic costs of pain in the United States. J Pain. 2012;13(8):715-724. doi:10.1016/j.jpain.2012.03.009.
Mariotto AB, Yabroff KR, Shao Y, Feuer EJ, Brown ML. Projections of the cost of cancer care in the United States: 2010-2020 [published correction appears in J Natl Cancer Inst. 2011 Apr 20;103(8):699]. J Natl Cancer Inst. 2011;103(2):117-128. doi:10.1093/jnci/djq495.
Mariotto AB, Enewold L, Zhao J, Zeruto CA, Yabroff KR. Medical Care Costs Associated with Cancer Survivorship in the United States. Cancer Epidemiol Biomarkers Prev. 2020 Jul;29(7):1304-1312. doi: 10.1158/1055-9965.EPI-19-1534. Epub 2020 Jun 10. PMID: 32522832.
Braithwaite RS, Meltzer DO, King JT Jr, Leslie D, Roberts MS. What does the value of modern medicine say about the $50,000 per quality-adjusted life-year decision rule?. Med Care. 2008;46(4):349-356. doi:10.1097/MLR.0b013e31815c31a7.
Ubel PA, Hirth RA, Chernew ME, Fendrick AM. What is the price of life and why doesn’t it increase at the rate of inflation? Arch Intern Med. 2003;163(14):1637-1641. doi:10.1001/archinte.163.14.1637.
Neumann PJ, Cohen JT, Weinstein MC. Updating cost-effectiveness – the curious resilience of the $50,000-per-QALY threshold. N Engl J Med. 2014;371(9):796-97. doi:10.1056/nejmp1405158.
Weinstein MC. How much are Americans willing to pay for a quality-adjusted life year?. Med Care. 2008;46(4):343-345. doi:10.1097/MLR.0b013e31816a7144.
Shiels MS, Haque AT, Haozous EA, et al. Racial and ethnic disparities in excess deaths during the COVID-19 pandemic, March to December 2020. Ann Intern Med. 2021;174(12):1693-1699. doi:10.7326/M21-2134
Woolf SH, Masters RK, Aron LY. Effect of the covid-19 pandemic in 2020 on life expectancy across populations in the USA and other high income countries: simulations of provisional mortality data. BMJ. 2021;373:n1343. Published 2021 Jun 23. doi:10.1136/bmj.n1343.
Oberg C, Colianni S, King-Schultz L. Child health disparities in the 21st century. Curr Probl Pediatr Adolesc Health Care. 2016;46(9):291-312. doi:10.1016/j.cppeds.2016.07.001.
Richard P, Gaskin DJ, Alexandre PK, Burke LS, Younis M. Children’s emotional and behavioral problems and their mothers’ labor supply. Inquiry. 2014;51:0046958014557946. Published 2014 Jan 1. doi:10.1177/0046958014557946.
Richard, P. Children’s mental disorders and their mothers’ earnings: implications for the Affordable Care Act of 2010. J Fam Econ Iss 37, 156–171 (2016). https://doi.org/10.1007/s10834-016-9486-3.
Cohen JW, Cohen SB, Banthin JS. The medical expenditure panel survey: a national information resource to support healthcare cost research and inform policy and practice. Med Care. 2009;47(7 Suppl 1):S44-S50. doi:10.1097/MLR.0b013e3181a23e3a.
Manning WG, Mullahy J. Estimating log models: to transform or not to transform?. J Health Econ. 2001;20(4):461-494. doi:10.1016/s0167-6296(01)00086-8.
Buntin MB, Zaslavsky AM. Too much ado about two-part models and transformation? Comparing methods of modeling Medicare expenditures. J Health Econ. 2004;23(3):525-542. doi:10.1016/j.jhealeco.2003.10.005.
Manning WG. The logged dependent variable, heteroscedasticity, and the retransformation problem. J Health Econ. 1998;17(3):283-295. doi:10.1016/s0167-6296(98)00025-3.
Mullahy J. Much ado about two: reconsidering retransformation and the two-part model in health econometrics. J Health Econ. 1998;17(3):247-281. doi:10.1016/s0167-6296(98)00030-7.
StataCorp. 2017. Stata Statistical Software: Release 15. College Station, TX: StataCorp LLC.
Ettner SL. The impact of “parent care” on female labor supply decisions. Demography. 1995;32(1):63-80.
Greene WH. Econometric Analysis. 8th ed. Stern School of Business: New York University: 2018.
Cameron AC, Trivedi, PK.. Microeconometrics using stata. 2nd ed. College Station, TX: Stata press: 2010.
Hirth RA, Chernew ME, Miller E, Fendrick AM, Weissert WG. Willingness to pay for a quality-adjusted life year: in search of a standard. Med Decis Making. 2000;20(3):332-342. doi:10.1177/0272989X00020003
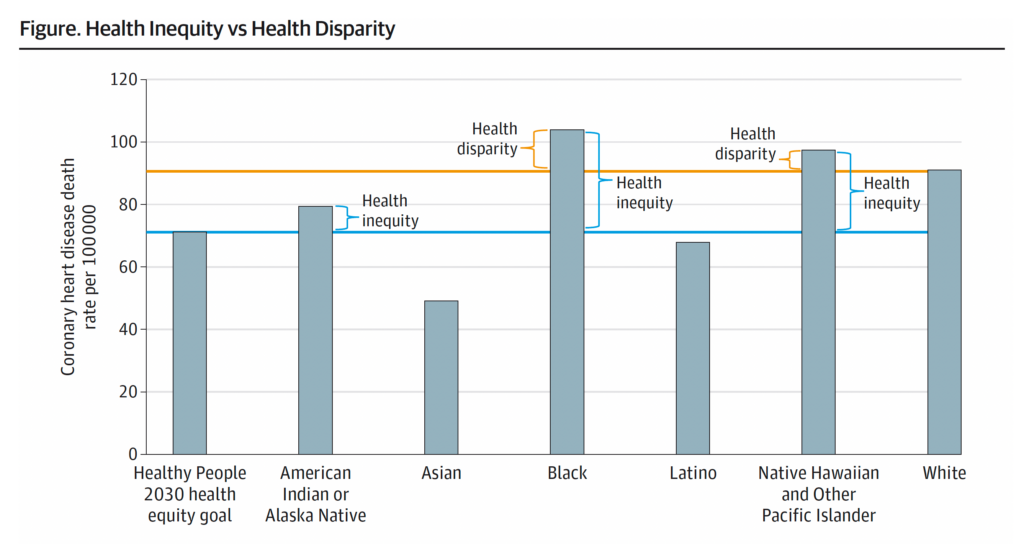
Figure 1. Health Inequity vs Health Disparity
2019 Coronary heart disease death rate. Health inequity and disparity are illustrated for each of 6 racial and ethnic population groups. The baseline for health inequity (shown in blue) is the Healthy People 2030 equity goal. The baseline for health disparity (shown in orange) is the mean for the White population
Table 1. Economic Burden of Excess Medical Care Expenditures, Loss of Productivity, and Premature Death Attributable to Racial and Ethnic Health Inequities in the US in 2018 ($ Billions)
Abbreviations: BRFSS, Behavioral Risk Factor Surveillance System; MEPS, Medical Expenditure Panel Survey; NVSS, National Vital Statistics System.
Native Hawaiian and Other Pacific Islander samples in the MEPS for age-sex cohorts were too small to compute estimates for medical care spending and labor market productivity.
Because the study primarily focuses on the burden of health inequities for racial and ethnic minorities, state-level estimates were not computed for the White population using the BRFSS.
Cost, $ in billions
Outcome
American Indian or Alaska Native
Asian
Black
Latino
Native Hawaiian or Other Pacific Islander
Total health inequities for non-White populations
White
Total
MEPS and National NVSS Estimates
Excess medical care costs
2.8
4.9
42.0
25.4
75.1
183.3
258.4
Lost labor market productivity
4.7
0.9
31.5
22.0
59.1
90.0
149.1
Excess premature deaths
20.0
0.0
238.0
9.4
19.5
286.9
335.4
622.3
Total
27.5
5.8
311.5
56.8
19.5
421.1
608.7
1029.8
BRFSS and State NVSS Estimates
Excess medical care costs
3.5
4.6
36.8
31.3
0.6
76.8
Lost labor market productivity
3.3
3.6
33.2
40.3
0.6
81.0
Excess premature deaths
19.5
0.2
239.6
22.6
11.1
293.0
Total
26.3
8.4
309.6
94.2
12.3
450.8
Table 2. Total Economic Burden of Health Inequities for each State and the District of Columbia in 2018 ($ Millions)
The bar graph is a visual representation of each number for purposes of comparison.
To compute excess medical care costs and lost labor market productivity, the authors computed states level estimates for 50 states and the District of Columbia (DC). State level prevalence rates for each race and ethnic group were computed using data from the 2016-2019 BRFSS. These rates were used to simulate medical care costs and labor market outcomes adjusting for age, gender, race, marital status, insurance status, education, family income, health status, health conditions and census regions of the country). Excess premature death costs were computed for each state and DC using state level data from National Vital Statistic System. GDP by states are published by The Bureau of Economic Analysis. Dollar amounts are in millions.
Total
State
Total
AL
13741.2
AK
2253.9
AZ
7867.7
AR
4652.6
CA
39502.5
CO
4131.4
CT
2330.3
DE
1839.3
DC
3487.4
FL
27346.5
GA
21156.0
HI
4457.5
ID
1407.0
IL
29253.8
IN
6849.7
IA
1533.4
KS
3541.8
KY
4097.8
LA
15308.8
ME
280.6
MD
14412.7
MA
3637.0
MI
16074.9
MN
4620.2
MS
10290.0
MO
8673.9
MT
1367.2
NE
1483.7
NV
8748.2
NH
284.3
NJ
10287.3
NM
5933.5
NY
18750.5
NC
19817.3
ND
767.1
OH
14868.9
OK
7677.2
OR
1745.6
PA
14723.2
RI
1187.0
SC
12140.9
SD
1587.0
TN
11211.9
TX
40606.2
UT
2565.3
VT
47.4
VA
11606.4
WA
5161.2
WV
403.4
WI
4568.6
WY
229.5
American Indian or Alaska Native
State
American Indian or Alaska Native
AL
9977
AK
17057
AZ
13247
AR
8550
CA
11240
CO
10274
CT
3769
DE
5585
DC
7480
FL
11504
GA
2176
HI
2428
ID
10335
IL
8295
IN
3586
IA
11168
KS
16676
KY
14348
LA
5651
ME
7232
MD
6228
MA
8850
MI
16615
MN
22096
MS
15517
MO
4577
MT
17314
NE
12245
NV
9571
NH
18509
NJ
3311
NM
12899
NY
3141
NC
10051
ND
15406
OH
6922
OK
12593
OR
10225
PA
13243
RI
9632
SC
4724
SD
20275
TN
13220
TX
6108
UT
9824
VT
9209
VA
2328
WA
17976
WV
10054
WI
10802
WY
10209
Asian
State
Asian
AL
71
AK
164
AZ
398
AR
16
CA
634
CO
219
CT
353
DE
169
DC
197
FL
263
GA
325
HI
782
ID
71
IL
475
IN
192
IA
59
KS
263
KY
28
LA
53
ME
147
MD
649
MA
187
MI
156
MN
314
MS
74
MO
269
MT
245
NE
119
NV
641
NH
24
NJ
777
NM
171
NY
819
NC
300
ND
174
OH
101
OK
155
OR
346
PA
283
RI
148
SC
105
SD
29
TN
116
TX
130
UT
110
VT
143
VA
445
WA
511
WV
653
WI
160
WY
148
Black
State
Black
AL
10254
AK
6490
AZ
5888
AR
9387
CA
7801
CO
6042
CT
5012
DE
7158
DC
10912
FL
6459
GA
6334
HI
1827
ID
2058
IL
9836
IN
10185
IA
9058
KS
9650
KY
9968
LA
9965
ME
814
MD
7190
MA
3770
MI
10202
MN
5579
MS
8801
MO
11790
MT
648
NE
7793
NV
9613
NH
816
NJ
7068
NM
5808
NY
4340
NC
7486
ND
411
OH
10022
OK
11100
OR
8321
PA
8940
RI
4198
SC
8929
SD
184
TN
9494
TX
6987
UT
3653
VT
362
VA
6575
WA
7205
WV
4108
WI
10636
WY
175
Latino
State
Latino
AL
1494
AK
6461
AZ
1048
AR
857
CA
828
CO
2018
CT
855
DE
4086
DC
419
FL
1133
GA
687
HI
7073
ID
5621
IL
5136
IN
1268
IA
2526
KS
4803
KY
2681
LA
1222
ME
10095
MD
2472
MA
2177
MI
2761
MN
5012
MS
2145
MO
1063
MT
6365
NE
3082
NV
6725
NH
4819
NJ
914
NM
3300
NY
1326
NC
2619
ND
6070
OH
1295
OK
2452
OR
989
PA
2535
RI
5696
SC
680
SD
4133
TN
1365
TX
1501
UT
4723
VT
1709
VA
1126
WA
761
WV
3147
WI
612
WY
1754
Native Hawaiian or Other Pacific Islander
State
Native Hawaiian or Other Pacific Islander
AL
1358
AK
604
AZ
20487
AR
2555
CA
35476
CO
12705
CT
3195
DE
11126
DC
443
FL
36384
GA
13201
HI
24017
ID
9728
IL
2710
IN
954
IA
1877
KS
3292
KY
25084
LA
6839
ME
6020
MD
1805
MA
3106
MI
578
MN
2410
MS
17241
MO
7056
MT
9739
NE
3119
NV
20712
NH
6078
NJ
1187
NM
3914
NY
33195
NC
17124
ND
590
OH
1151
OK
1032
OR
13064
PA
1017
RI
444
SC
1595
SD
1631
TN
549
TX
37993
UT
6968
VT
998
VA
16909
WA
21175
WV
5474
WI
512
WY
1348
Economic Burden per Capita in US Dollars for Racial and Ethnic Health Inequities in 2018
Location
American Indian or Alaska Native
Asian
Black
Latino
Native Hawaiian or Other Pacific Islander
AL
9977
71
10254
1494
1358
AK
17057
164
6490
6461
604
AZ
13247
398
5888
1048
20487
AR
8550
16
9387
857
2555
CA
11240
634
7801
828
35476
CO
10274
219
6042
2018
12705
CT
3769
353
5012
855
3195
DE
5585
169
7158
4086
11126
DC
7480
197
10912
419
443
FL
11504
263
6459
1133
36384
GA
2176
325
6334
687
13201
HI
2428
782
1827
7073
24017
ID
10335
71
2058
5621
9728
IL
8295
475
9836
5136
2710
IN
3586
192
10185
1268
954
IA
11168
59
9058
2526
1877
KS
16676
263
9650
4803
3292
KY
14348
28
9968
2681
25084
LA
5651
53
9965
1222
6839
ME
7232
147
814
10095
6020
MD
6228
649
7190
2472
1805
MA
8850
187
3770
2177
3106
MI
16615
156
10202
2761
578
MN
22096
314
5579
5012
2410
MS
15517
74
8801
2145
17241
MO
4577
269
11790
1063
7056
MT
17314
245
648
6365
9739
NE
12245
119
7793
3082
3119
NV
9571
641
9613
6725
20712
NH
18509
24
816
4819
6078
NJ
3311
777
7068
914
1187
NM
12899
171
5808
3300
3914
NY
3141
819
4340
1326
33195
NC
10051
300
7486
2619
17124
ND
15406
174
411
6070
590
OH
6922
101
10022
1295
1151
OK
12593
155
11100
2452
1032
OR
10225
346
8321
989
13064
PA
13243
283
8940
2535
1017
RI
9632
148
4198
5696
444
SC
4724
105
8929
680
1595
SD
20275
29
184
4133
1631
TN
13220
116
9494
1365
549
TX
6108
130
6987
1501
37993
UT
9824
110
3653
4723
6968
VT
9209
143
362
1709
998
VA
2328
445
6575
1126
16909
WA
17976
511
7205
761
21175
WV
10054
653
4108
3147
5474
WI
10802
160
10636
612
512
WY
10209
148
175
1754
1348
US (overall)
12351
487
7797
1643
23225
Mean (SD) across states
10,281 (4,930)
262 (215)
6,614 (3,390)
2,856 (2,183)
8,976 (10,551)
Table 5. Economic Burden of Racial and Ethnic and Education-Related Health Inequities
The “Racial and ethnic health inequities” totals do not compute state-level estimates for the White population and adults with 4-year college or more because the study focuses on burden of health inequities for disadvantaged populations.
The “Education-related health inequities” fields are divided by the 2018 gross domestic product for each states and the nation, which are published by The Bureau of Economic Analysis.
Economic Burden of Racial and Ethnic and Education-Related Health Inequities